Scraping and searching for undervalued movie stars (and fun with plotly)
tags: python web scraping beauitifulsoup linear regression plotly
Scraping Data from Box Office Mojo
Box Office Mojo is a website that tracks box office revenue in a systematic, algorithmic way and is widely used within the movie industry as a source of data source.
See my GitHub repo for this project to check out the code that scrapes data for every movie released in the last 25 years (~15,000 titles). luther_utils.py has all of the scraping functions, and BoxOfficeMojoScrape.ipynb shows how the functions are called.
Building the Models
I built a baseline model using budget, theaters in release, season, and some significant genres (e.g. Animation), then looked for actors, directors, and writers that tend to be in movies that over-perform (or under-perform) the baseline model.
Further detail will be added to this post about how features were selected, how models were created, and the limitations of the analysis, but if you want you can check out MovieAnalysis.ipynb to get an idea of my process.
Plotly (and using it with python)
I was recently introduced to an online data visualization tool called plotly. Chris Parmer (the Chief Product Officer of Plotly) showed me how, with just a few lines of code you can turn a matplotlib figure (efficient, but not the most striking figures you've ever seen) into an online, interactive, and editable graph. There are option for exporting the graphs you create and modify to python (among others); but even easier, you can embedding them in html (which is how the examples below are being served to you). d3.js is still going to give you more control to build what you need, but plotly streamlines the process of building good-looking, interactive plots in minutes.
Check out plotly's getting started with python and matplotlib/plotly documentation pages for implementation details. The documentation is great, but just to show you how simple it is: once you have plotly installed, it's literally two line of code to send a plot up to plotly for editing.
fig = plt.gcf()
plot_url = py.plot_mpl(fig, filename='file_name_for_plotly')
Giving plotly a go with movie data
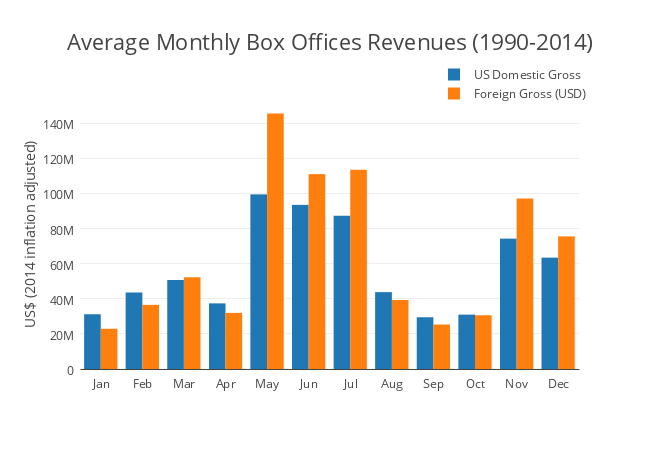
The seasonality effect is very real
One of the key features that stood out to me was the very clear seasonal boost that box office revenues receive during the summer and holiday seasons. Based on this observation, I encoded movies released May-July as 'summer' and November-December as 'holiday'. These two features turned out to be highly significant and drastically improved the performance of the models.
What we've all been waiting for
Summarized below is a visualization of the significantly good (or bad) actors, directors, and writers. The multiplier can be interpreted just like it sounds -- a multiplier on the gross box office revenue associated with that person.
For example, Will Smith's ~2.1 value means that in that data set we used, his presence accounts for a more than doubling of revenue. But maybe we already knew that... Use the plot to see who made the list and the top (or bottom) three films the boosted (or depressed) their observed. multiplier.
There are definitely some people that appear because they made it huge with a franchise (e.g. Lord of the Rings or Harry Potter), so that could be amounted for in an improved model. Some well-known names appear at the bottom of the list... so that's interesting as well.
Let me know in the comments if you have any further ideas on this or ideas as to why some of these people have very high (or low) revenue multipliers.
